<<Previous | Next>>
InfraRED WEB GUI can be effectively used to diagnose problems in the application. This documentation explains the various aspects of InfraRED and how its features can be leveraged.
Statistics for multiple application instances / Clustered applications: If you have configured InfraRED to work as a centralized server then the Performance Summary page will list all the applications and the hosts for which data is available. You can view data for one application at a time or can select multiple applications or host names and view the aggregated data.
Usage of InfraRED in various environments: InfraRED can be used to debug performance problems that occur in production. You would need to turn on monitoring, JDBC monitoring and JDBC Fetch statistics collection. This would give you summary information that can be used to narrow down a performance problem, without adversely affecting the application performance. Call tracing can be enabled in the development environment, along with turning on monitoring, JDBC monitoring and JDBC Fetch statistics collection to study the bottlenecks.
Performance Summary
Performance Summary page gives the summary of the layers. Analysis of the statistics can be started from here. It shows you information on how much time is being spent in executing methods in each layer. The time shown includes the time spent in executing methods that belong to this layer as well as any other functions that are called from within those methods (for e.g. the web layer would include the time consumed by the web layer code, as well as time spent in lower layers). From this you can figure out which layer to investigate further. If the JDBC layer is consuming a disproportionate amount of time you can start by investigating that further.
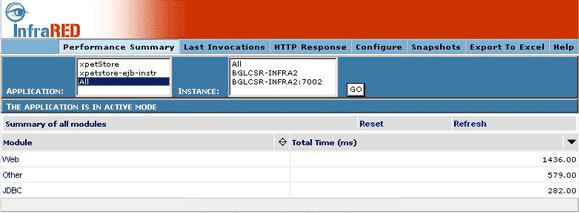
Figure 1
API and JDBC Summary page: Clicking on the JDBC layer link will take you to a page that has more detailed information about the JDBC API calls made by the application and the SQL queries that were executed. From the API summary you can get an idea of how many SQL queries were executed, the average execution time etc. The 'prepare to execute' ratio gives you an idea of how many statements were prepared vs. how many were executed. If this ratio is high it is an indication that the prepared statement cache is incorrectly configured.

Figure 2
Expensive queries: The second section lists the Top 10 expensive queries based on their average execution time. Take a close look at these queries to see if they can be tuned to perform better. Clicking on the SQL query link would show the complete query in a pop-up window. You can copy the SQL into SQL Plus or TOAD for further analysis.
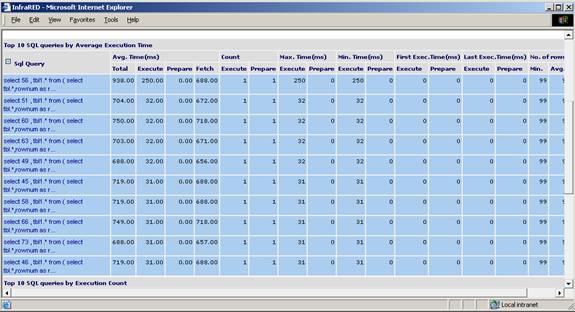
Figure 3
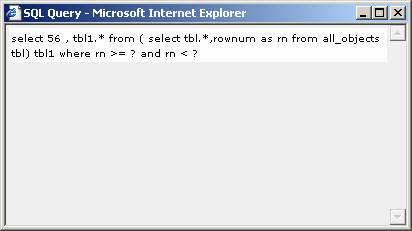
Figure 4
Frequently used queries: The next table lists the TOP 10 most frequently executed queries. Any small improvement that can be made by tuning these queries will have a bigger impact on the overall performance of the application. This can also help you identify if there are any "n+1 query problems".
N+1 Query problem is the situation where, to fetch n objects, one query is fired to fetch the ids of all the objects and n subsequent queries are fired to fetch the attributes of the object, instead of fetching both the ids and the attributes together in a single query. For e.g. if the use case is to fetch a bunch of Accounts and if you see one query to the ACCOUNT table and N queries to the Customer table (one for each Account) n+1 problem would be evident by looking at this data. You can optimize this by modifying the code to get the Accounts as well as Customers in one query by using a join query.

Figure 5
Fetch Statistics: If the fetch statistics is turned on you will also get information on the number of rows being fetched (for select queries). This will help you identify cases where more data than necessary is being fetched from the database. Typically a query shouldn't fetch more than 25 to 50 rows (or whatever can be displayed on one UI page). If for some queries the number of rows fetched is large you can take a look at it and see if pagination logic can be used to fetch relevant portions of the result set at a time. If a large amount of data is being fetched and all that data is needed for some processing in the application, you can investigate the possibility of pushing that processing to the database.
Summary of module: Clicking on any layer will bring up the summary for that layer. This will list all the methods that have been grouped under that layer along with the average time, count, minimum, maximum time etc. You can sort on any of the fields. Also any method with an average execution time above a specified threshold (specified in the infrared.web.properties file) is highlighted with a blue background.
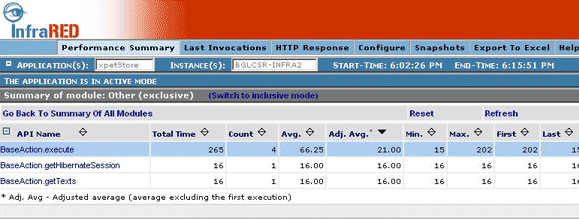
Figure 6
Usage of Call Trace: The summary page would point out methods that need further investigation. The average time shown here includes the time spent in executing a given method as well as the time spent in the methods that are directly invoked from within it. To investigate this further you would need to enable the call-tracing feature. Turning on call tracing adds extra overhead (up to 10%), it is not recommended to have it turned on by default in a production environment. You can turn it on for a small duration in case the issue cannot be reproduced in a development environment. Using this information if you can reproduce the problem in a development environment then you can continue the investigation in your development environment. Clicking on any method will take you to the Call traces page, which would display all the child methods that are being called from within this method. You will be able to get this information only if call tracing is turned on. You expand the tree and further drill down to identify the method that is consuming the most amount of time.
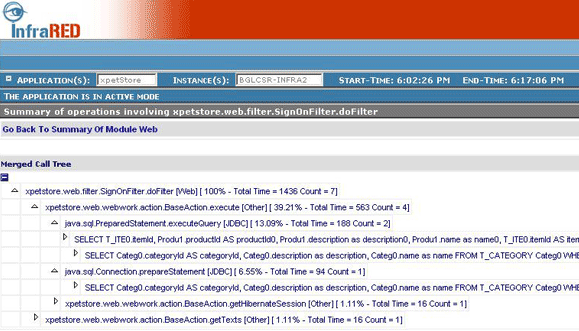
Figure 7
SQL queries as part of call tree: If there are any database interactions happening, the JDBC API invoked and the SQL queries executed will also be shown as a part of the call tree. This is useful in figuring out the methods that are invoking expensive SQL queries. This information is difficult to obtain even by looking at the code if you are using a tool (Toplink / Hibernate / EJB CMP) for persistence.
Also all the SQL queries executed in the context of this particular call sequence are displayed in a table below the tree.
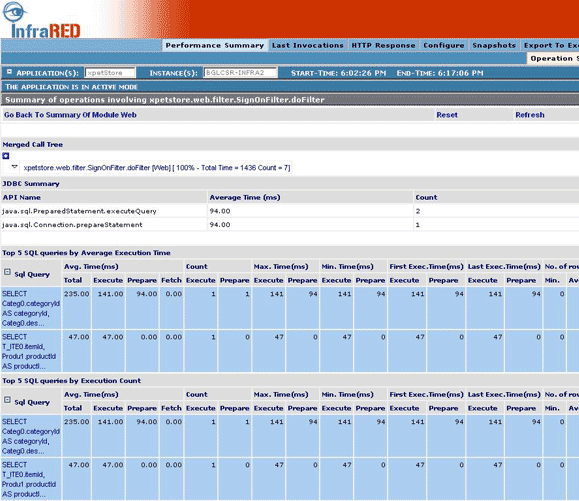
Figure 8
Last Invocation
All the information described above is aggregated statistics. If you are debugging a particular request to your application and want to look at what transpires when a request is executed, you can look at the Last Invocations page. This is particularly very useful in dev environment. This page provides the call trace for the last 5 (this can be changed by modifying the infrared.web.properties) requests that were executed.
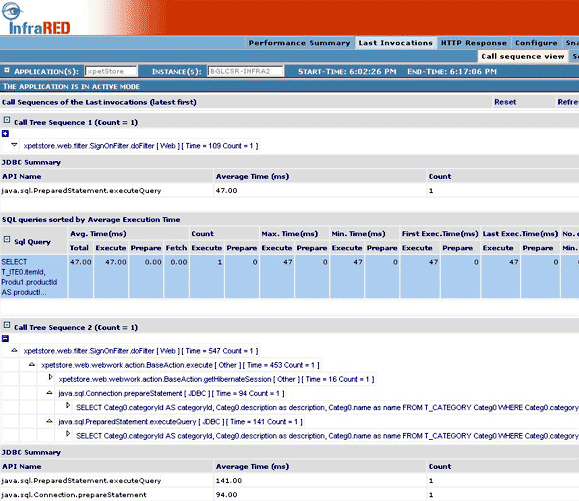
Figure 9
SQL Query view of last invocation: You might also want to look at all the SQL queries that are being executed by a single request and the method from which they are being called. This information is available in the SQL query view.
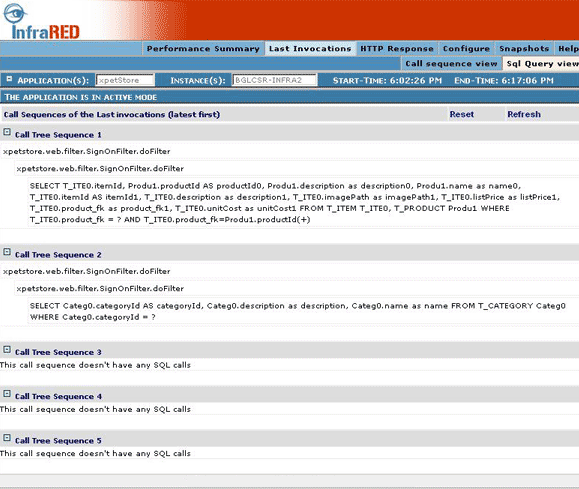
Figure 10
SQL Logging: The information displayed in the SQL query view can also be logged to a file on a continuous basis for each request as they happen. To do this you would need to add the following category configuration to the log4j.xml file.
<category name =" net.sf.infrared.SqlLog " additivity =" false ">
<priority value ="INFO " />
<appender-ref ref ="SQLLOG " />
</category> |
The SQL log is useful for communicating the problem back to the development team. The QA team or the performance team can attach this along with bug reports or mails.
Persistence
InfraRED can persist the data it collects to a file. InfraRED provides an interface, net.sf.infrared.web.persistence.PersistenceProvider, which can be overridden to persist data to another medium like database. The required implementation of the PersistenceProvider interface can be specified against the property net.sf.infrared.persistence in infrared.web.properties.
The current value of this property is net.sf.infrared.web.persistence.FilePersist. The performance data that is collected in memory is periodically persisted using a timer-based task. After persisting the data, the statistics in the memory are reset. The timer frequency for persistence can be adjusted in infrared.web.properties file, the value in the release is net.sf.infrared.performanceDataTransfer.timerFrequency=600000
When file persistence is chosen, data collected by InfraRED is logged into the directory specified by the property net.sf.infrared.persistLogsDir. A new XML file is created each day in this directory and performance metrics persisted to it.
<<Previous | Next>>
|

