| OVERVIEW |
|
|
| DOCUMENTATION |
|
| RESOURCES |
|
|
|
| Screen Shots |
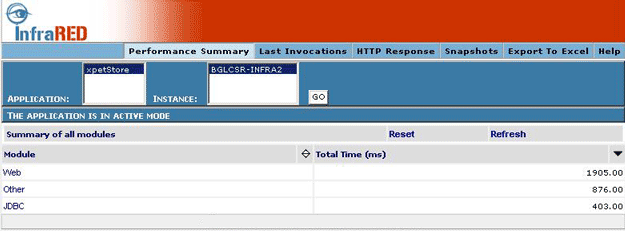 |
| One or more applications can be chosen on this page to view the performance data. Layer wise summary of the performance statistics for the chosen application are shown under it. |
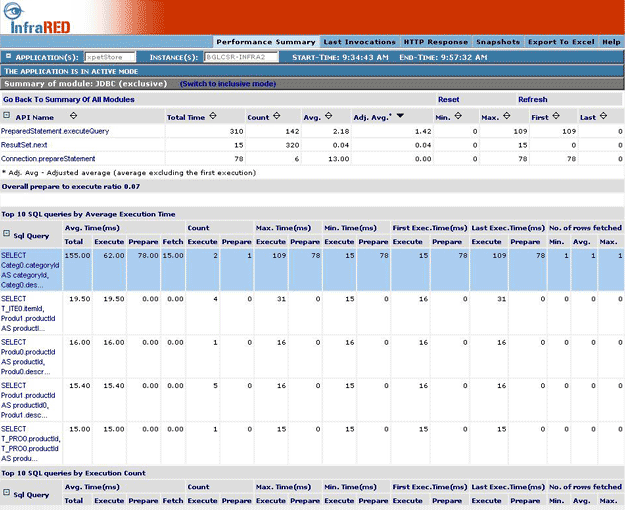 |
| Minimum, Maximum, First, Last, Average API times for the various API in the layer are shown here. Top 10 most expensive queries and most frequent queries are also shown. Queries taking more than the threshold value are highlighted in different color. APIs can be clicked to see call trace. |
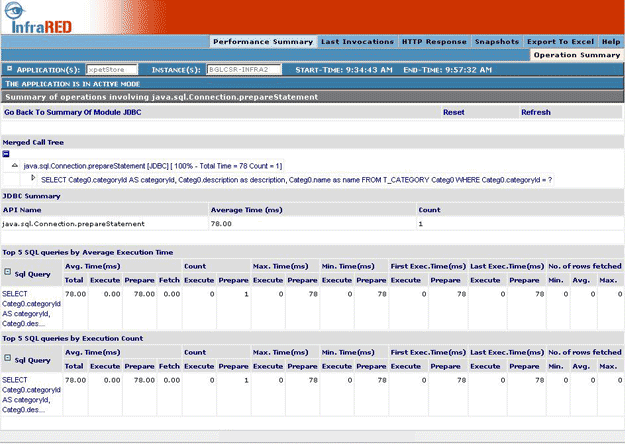 |
| Merged Call trace for the API can be seen here. Call trace also lists the Sql query called in the call trace. Top 5 most expensive and most frequent queries for this call trace are shown below it. |
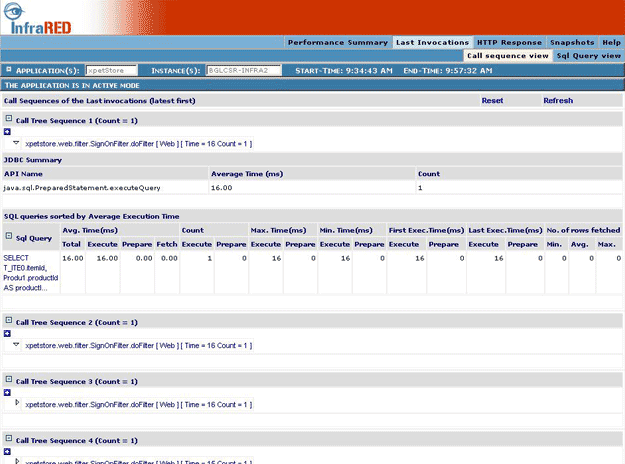 |
| Call Trace for 5 last invoked requests are shown on this page. Preparation and execution times for Sql queries executed in each invocation are also shown. |
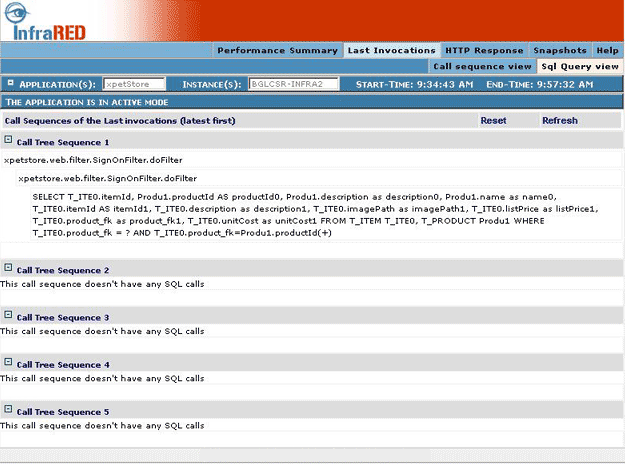 |
| Sql queries executed in last 5 requests to the application are shown with the API call trace, in which these queries are executed. |
 |
| Average response time taken by the application and total hits to the application can be seen on this page. |
 |
| Snap shot of the performance statistics can be saved at any point of time and can be loaded from this page. |
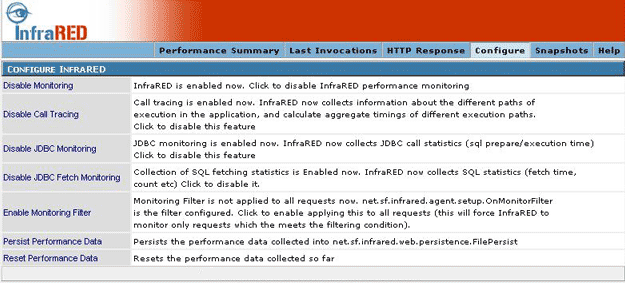 |
| InfraRED properties can be configured from this page for local collection strategy. |
|
|

