User Guide
Developer Guide
Project Documentation


One or more applications can be chosen to view the performance data. Hierarchical layer summary and absolute layer summary are displayed. Absolute layer summary shows the time spent in each layer. Hierarchical layer summary show the time of the last layer in the dotted notation when this layer is called from the layers that precede it in the layer name (For eg if the layer is Web.Xpetstore.JDBC the time displayed is the time spent in the JDBC layer when called from the Layer Web.Xpetstore).

Maximum, Minimum, First, Last , Min , Max times for the apis that belong to the layer chosen
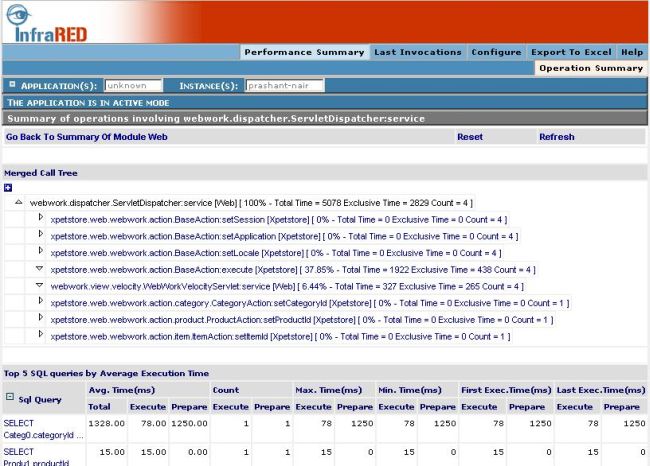
Merged call tree for the api that has been chosen. It also displays the top 5 sql queries by execution time and execution count.

Call trace for the last 5 requests. This page also displays the top 5 sql queries by execution time and execution count.

This page is used to choose the data collection mode for InfraRED. Persistent data can be read from the DB by choosing the DB option. Live data is the data that is collected by InfraRED during the execution of the instrumented application.